hmuratsayin
GVT has shown bullish trend last weekend as expected and return back to 18k levels. Bollinger band has widened, but price is still touching below the line. Stoch RSI is in oversold region and volume is still very low. I can not put more than 3 indicators because of not buying pro membership, but can see each indicators separately before pasting this...
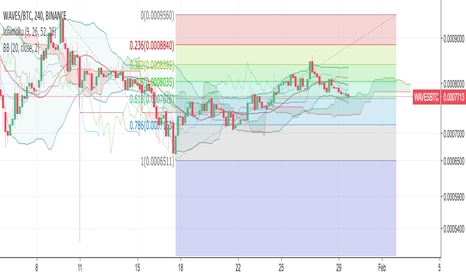
Waves has been very inactive in terms of volume amount. Ichimoku cloud shows bullish signal is active. Price line is touching the lowest line of Bollinger Band. RSI and CCI lines support oversold region which indicates that buying mechanism can be activated soon. However, since I am not a pro member, I could not show these indicators as well. I am expecting a...
GVT has been stable lately. Bollinger Bands is very narrow which indicates that big movement is coming up. Stock RSI and CCI may indicate that bullish signal may also be coming in the near future. 21000 level is the first target according to fibonacci tracements. 32000 level is middle term target. Since I am not a pro member, I can not put more than 3 indicators...
Returned from 0.518 fib line. possible mini cup and handle. short term target is 20500. DYOR. This is my first publication here.


