FSOY1! trade ideas
SOYBEAN OIL FUTURES (MAR 2019), 1D, CBOTTrading Signal
Short Position (EP) : 30.62
Stop Loss (SL) : 30.91
Take Profit (TP) : 30.04
Description
ZSH2019 formed Double Repo Sell at 1d time frame. Trade setup with Sell Limit at 0.382 Level (30.62) and place stop after 0.618 level (30.91). Once the position was hit, place take profit before an agreement (30.04)
Money Management
Money in portfolio : $1,000,000
Risk Management (1%) : $10,000
Position Sizing
$0.01 = +-$ 6.00/std-contract
Commission fee = -$5.64/contract (Standard)
EP to SL = $0.29 = -$174
Contract size to open = 57 standard contracts
EP to TP = $0.58 = +$348
Expected Result
Commission Fee = -$321.48
Loss = -$9,918
Gain = +$19,836
Risk/Reward Ratio = 1.91
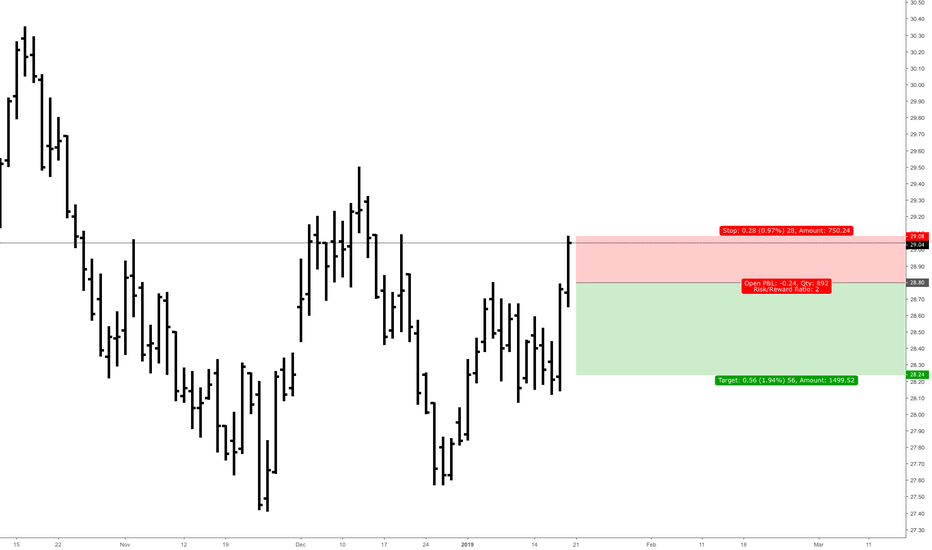
SOYBEAN OIL FUTURES (MAR 2019), 1D, CBOTTrading Signal
Short Position (EP) : 28.8
Stop Loss (SL) : 29.08
Take Profit (TP) : 28.24
Description
ZLH2019 formed Turtle Soup Sell at 1d time frame. Trade setup with Sell Limit at 0.382 Level (28.8) and place stop after 0.618 level (29.08). Once the position was hit, place take profit before an agreement (28.24)
Money Management
Money in portfolio : $280,000
Risk Management (1%) : $2,800
Position Sizing
$0.01 = +-$ 6.00/std-contract
Commission fee = -$5.64/contract (Standard)
EP to SL = $0.28 = -$168
Contract size to open = 16 standard contracts
EP to TP = $0.56 = +$336
Expected Result
Commission Fee = -$90.24
Loss = -$2,688
Gain = +$5,376
Risk/Reward Ratio = 1.9
Kathy Lien Double Bollinger Band Strategy.As per Kathy Lien's Double Bollinger Band Strategy, here we can see a short opportunity as the price action has broken and closed below the 20 day, 1 standard deviation band. We take the open, or as i do the low of the previous close plus 1 tick for a short sell stop order.
Initial stop loss once in the trade is 1 tick about the 15 day simple MA and I aim for a profit target of 1.6 times entry and stop loss difference.


